How to load, process and visualize weather data from OpenWeather in the Databricks Lakehouse
In this HowTo I will show you how to load weather data from the OpenWeather API into the Databricks Lakehouse. The data is loaded via REST API from OpenWeather and then processed in the Medallion architecture in the Lakehouse. Finally, I build a simple Lakeview dashboard on top of it.
Contents
Preparation
I assume that you already have a Databricks environment including Unity Catalog. If not, I have explained the setup in a previous article. You also need a free account with OpenWeather and an Azure KeyVault to securely store the API key.
OpenWeather

OpenWeather is a company that provides weather data and forecasts via a variety of APIs (Application Programming Interfaces). These APIs allow developers to access current weather data and forecasts for various locations around the world.
A subscription is required for certain APIs so that you can download the data, but there are also some that are free. Among others the “Current Weather Data”. You can find an overview of the APIs here: https://openweathermap.org/api
To be able to tap into the API, you must first create a free account. https://home.openweathermap.org/users/sign_up
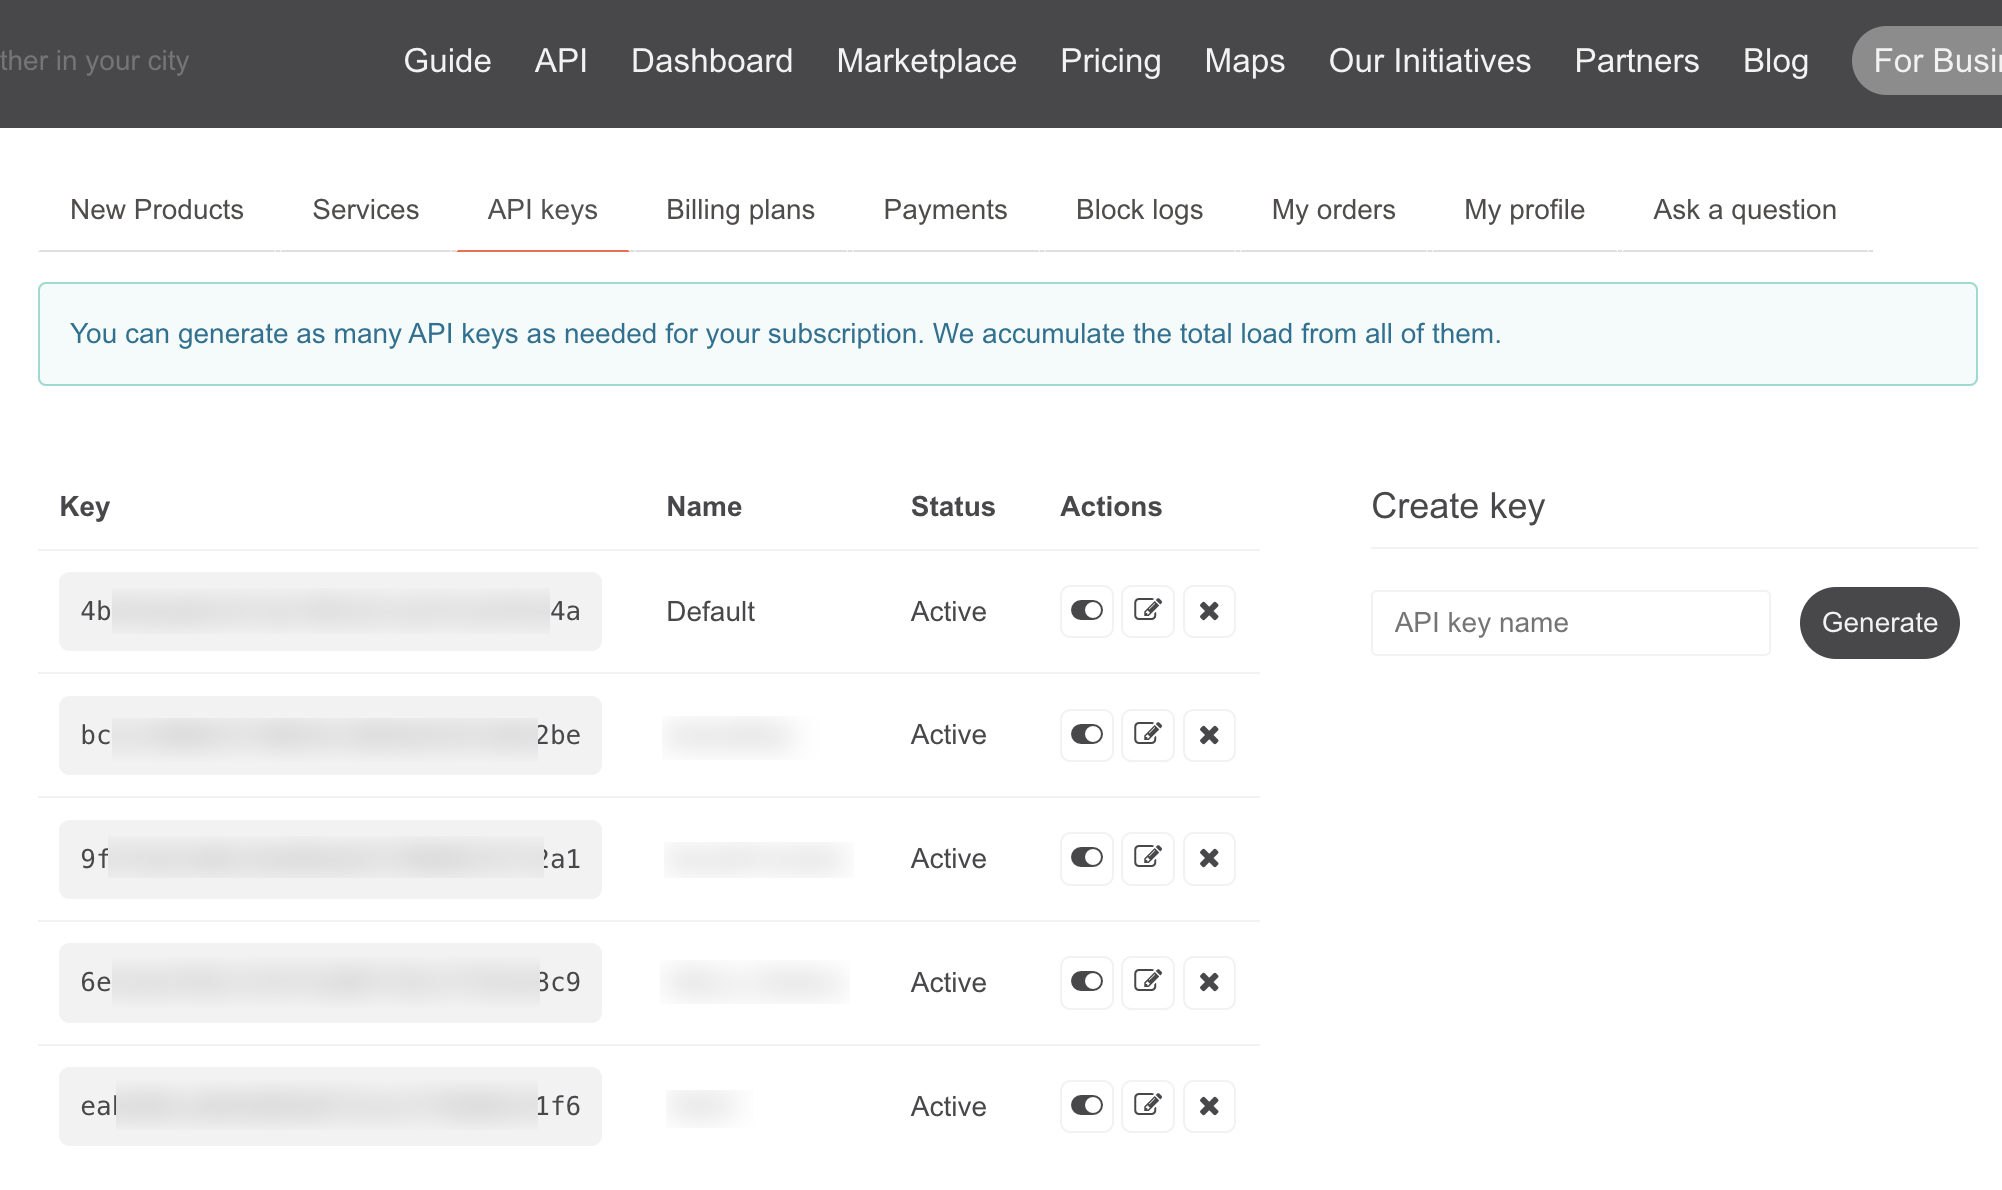
After registering, you can access the API under your user account.

An API key with the name Default is already available by default. You can of course create additional keys if you are running different applications.
Azure KeyVault
Using the API key in plain text in a code would be fatal and represents a major security risk. For this reason, I store the key in an Azure KeyVault so that I only have to reference it in my code and can securely check the code into a repo.
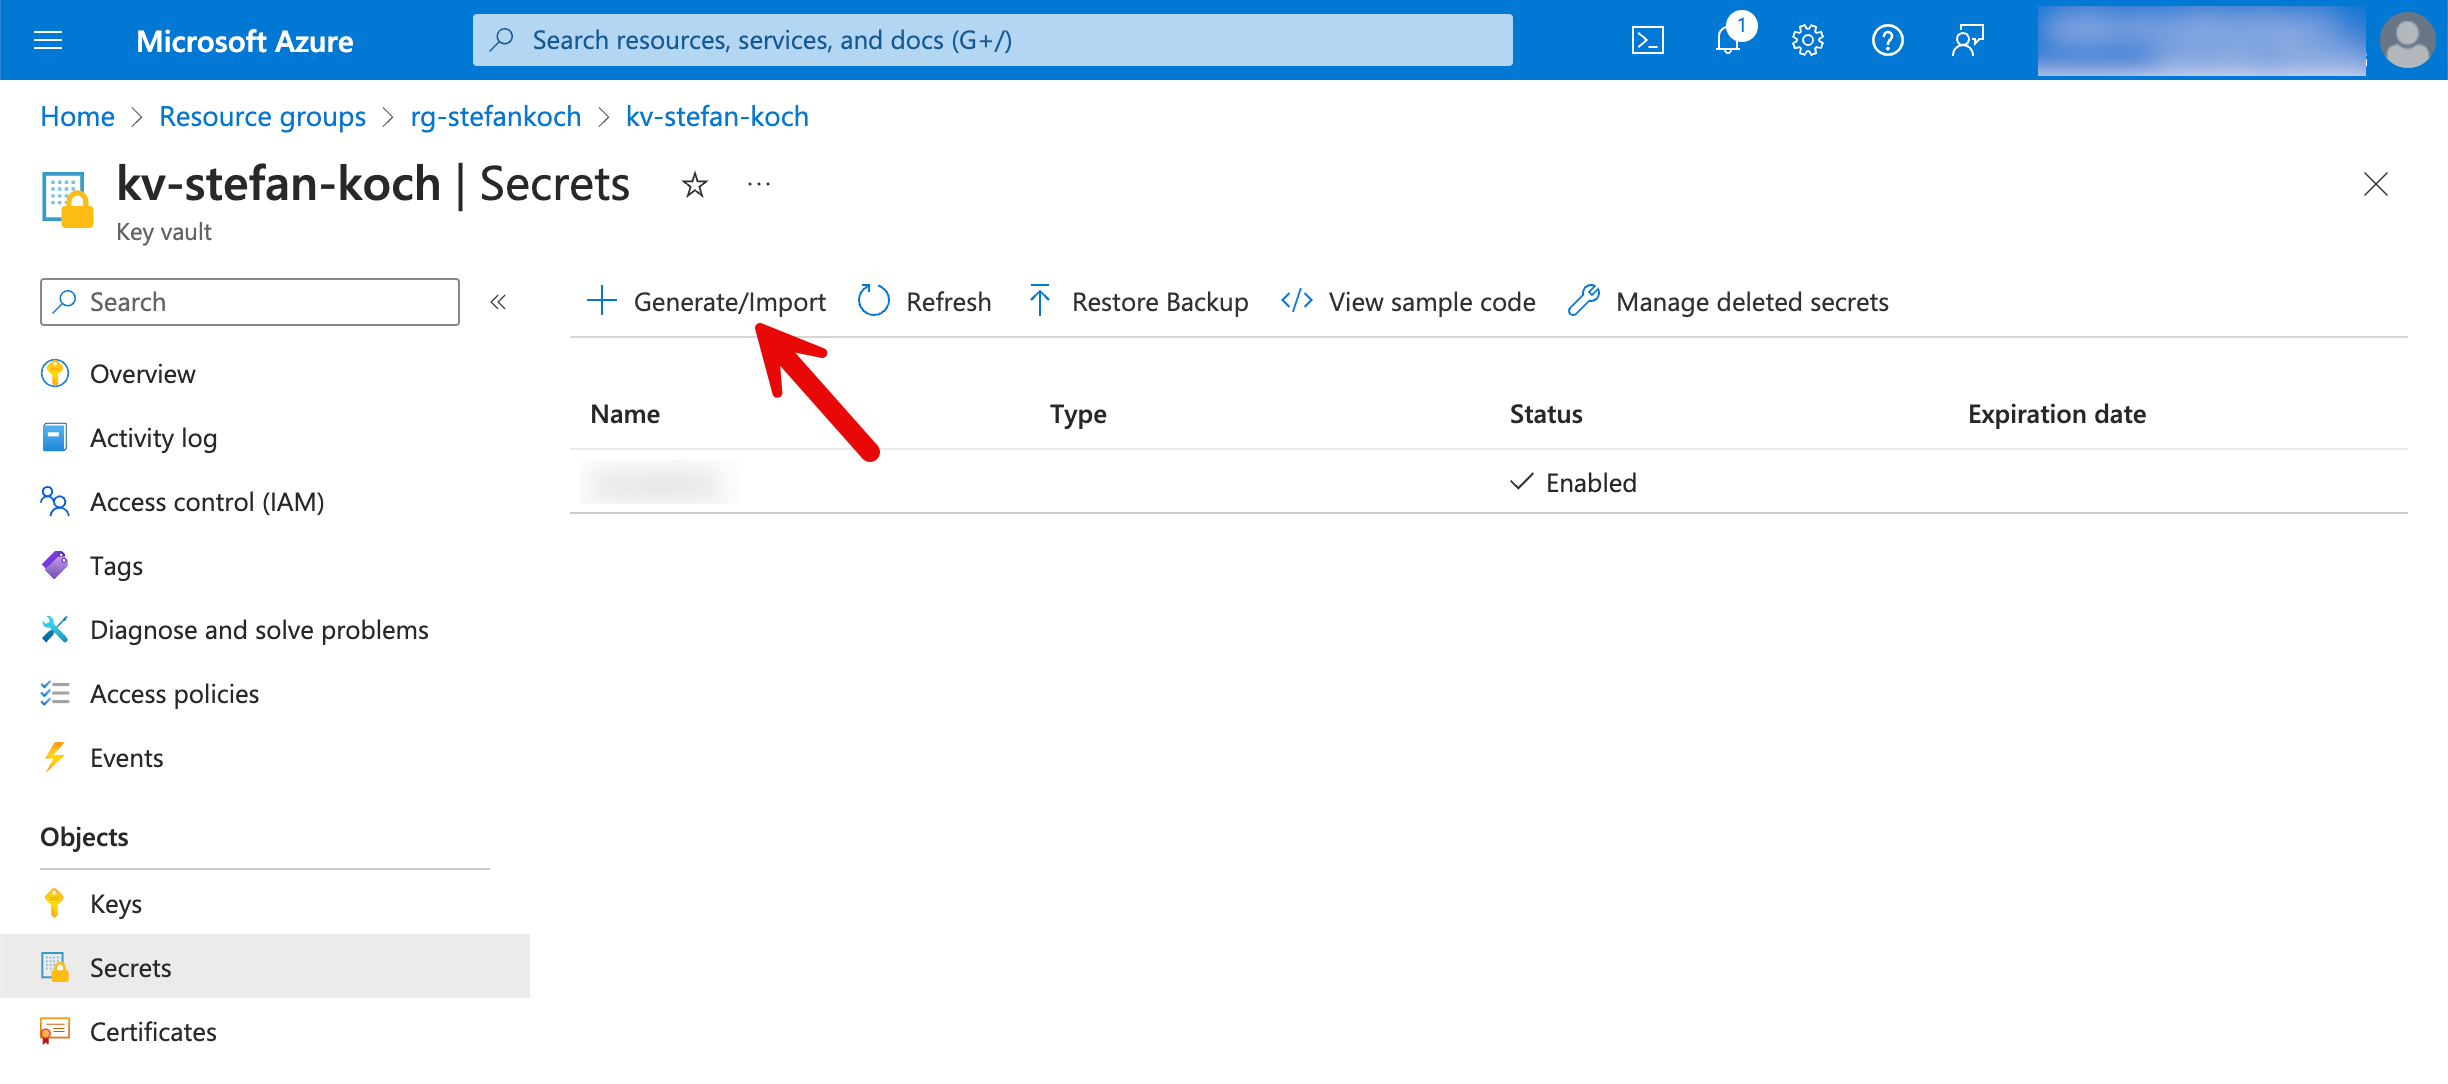
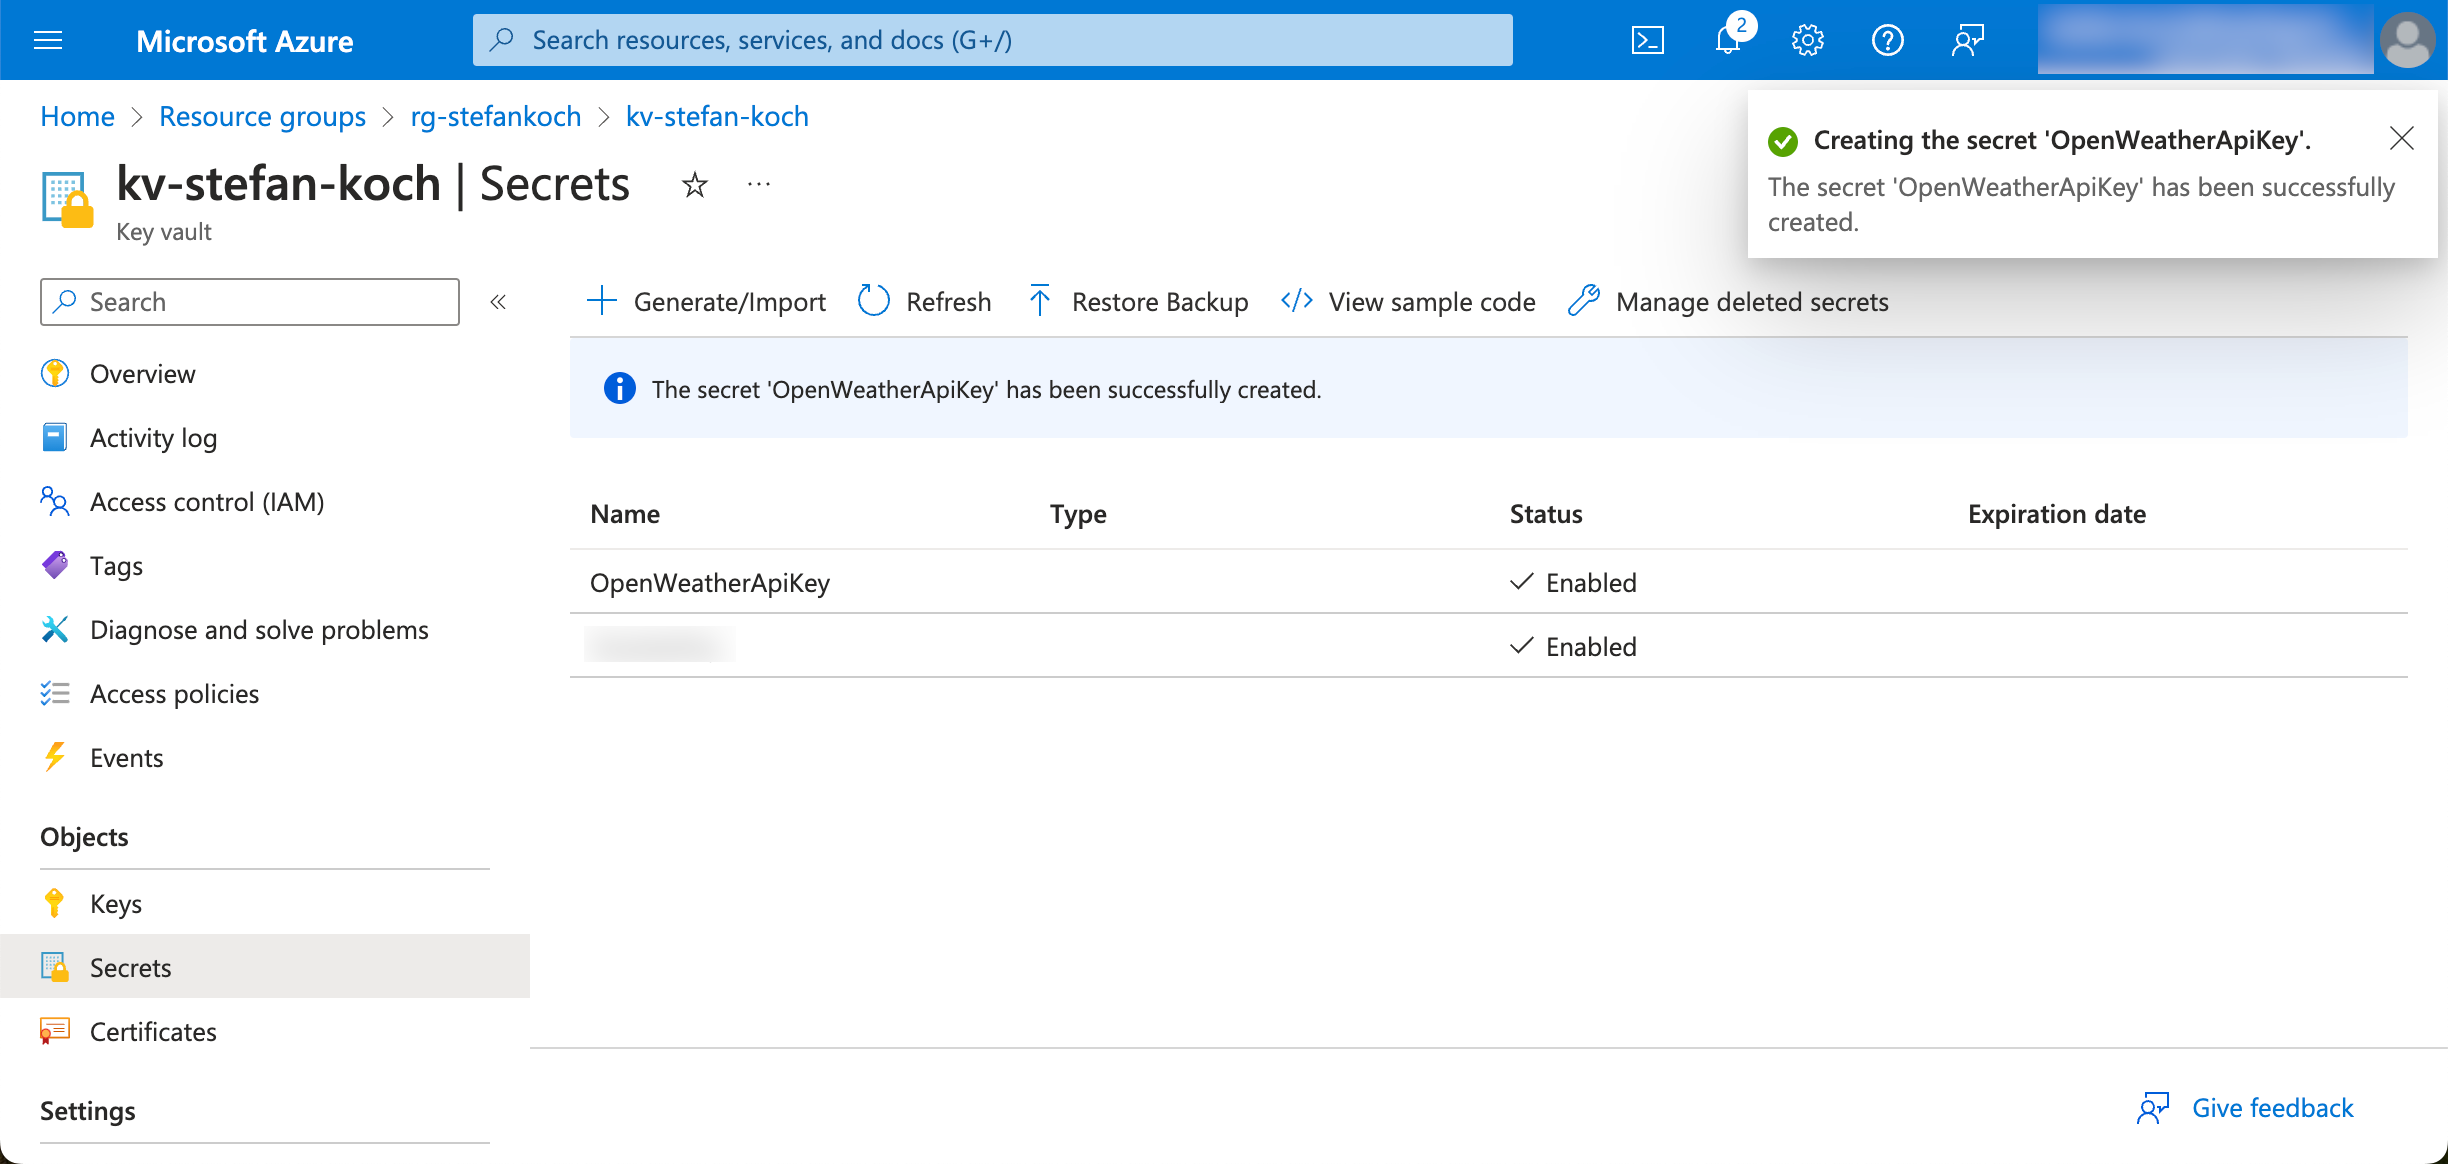
In the Azure portal, I navigate to my KeyVault and create a new secret.

Click on “Generate/Import” in the Secrets tab.
I give the new secret to be created a descriptive name so that you can later recognize from the name what this secret was created for.
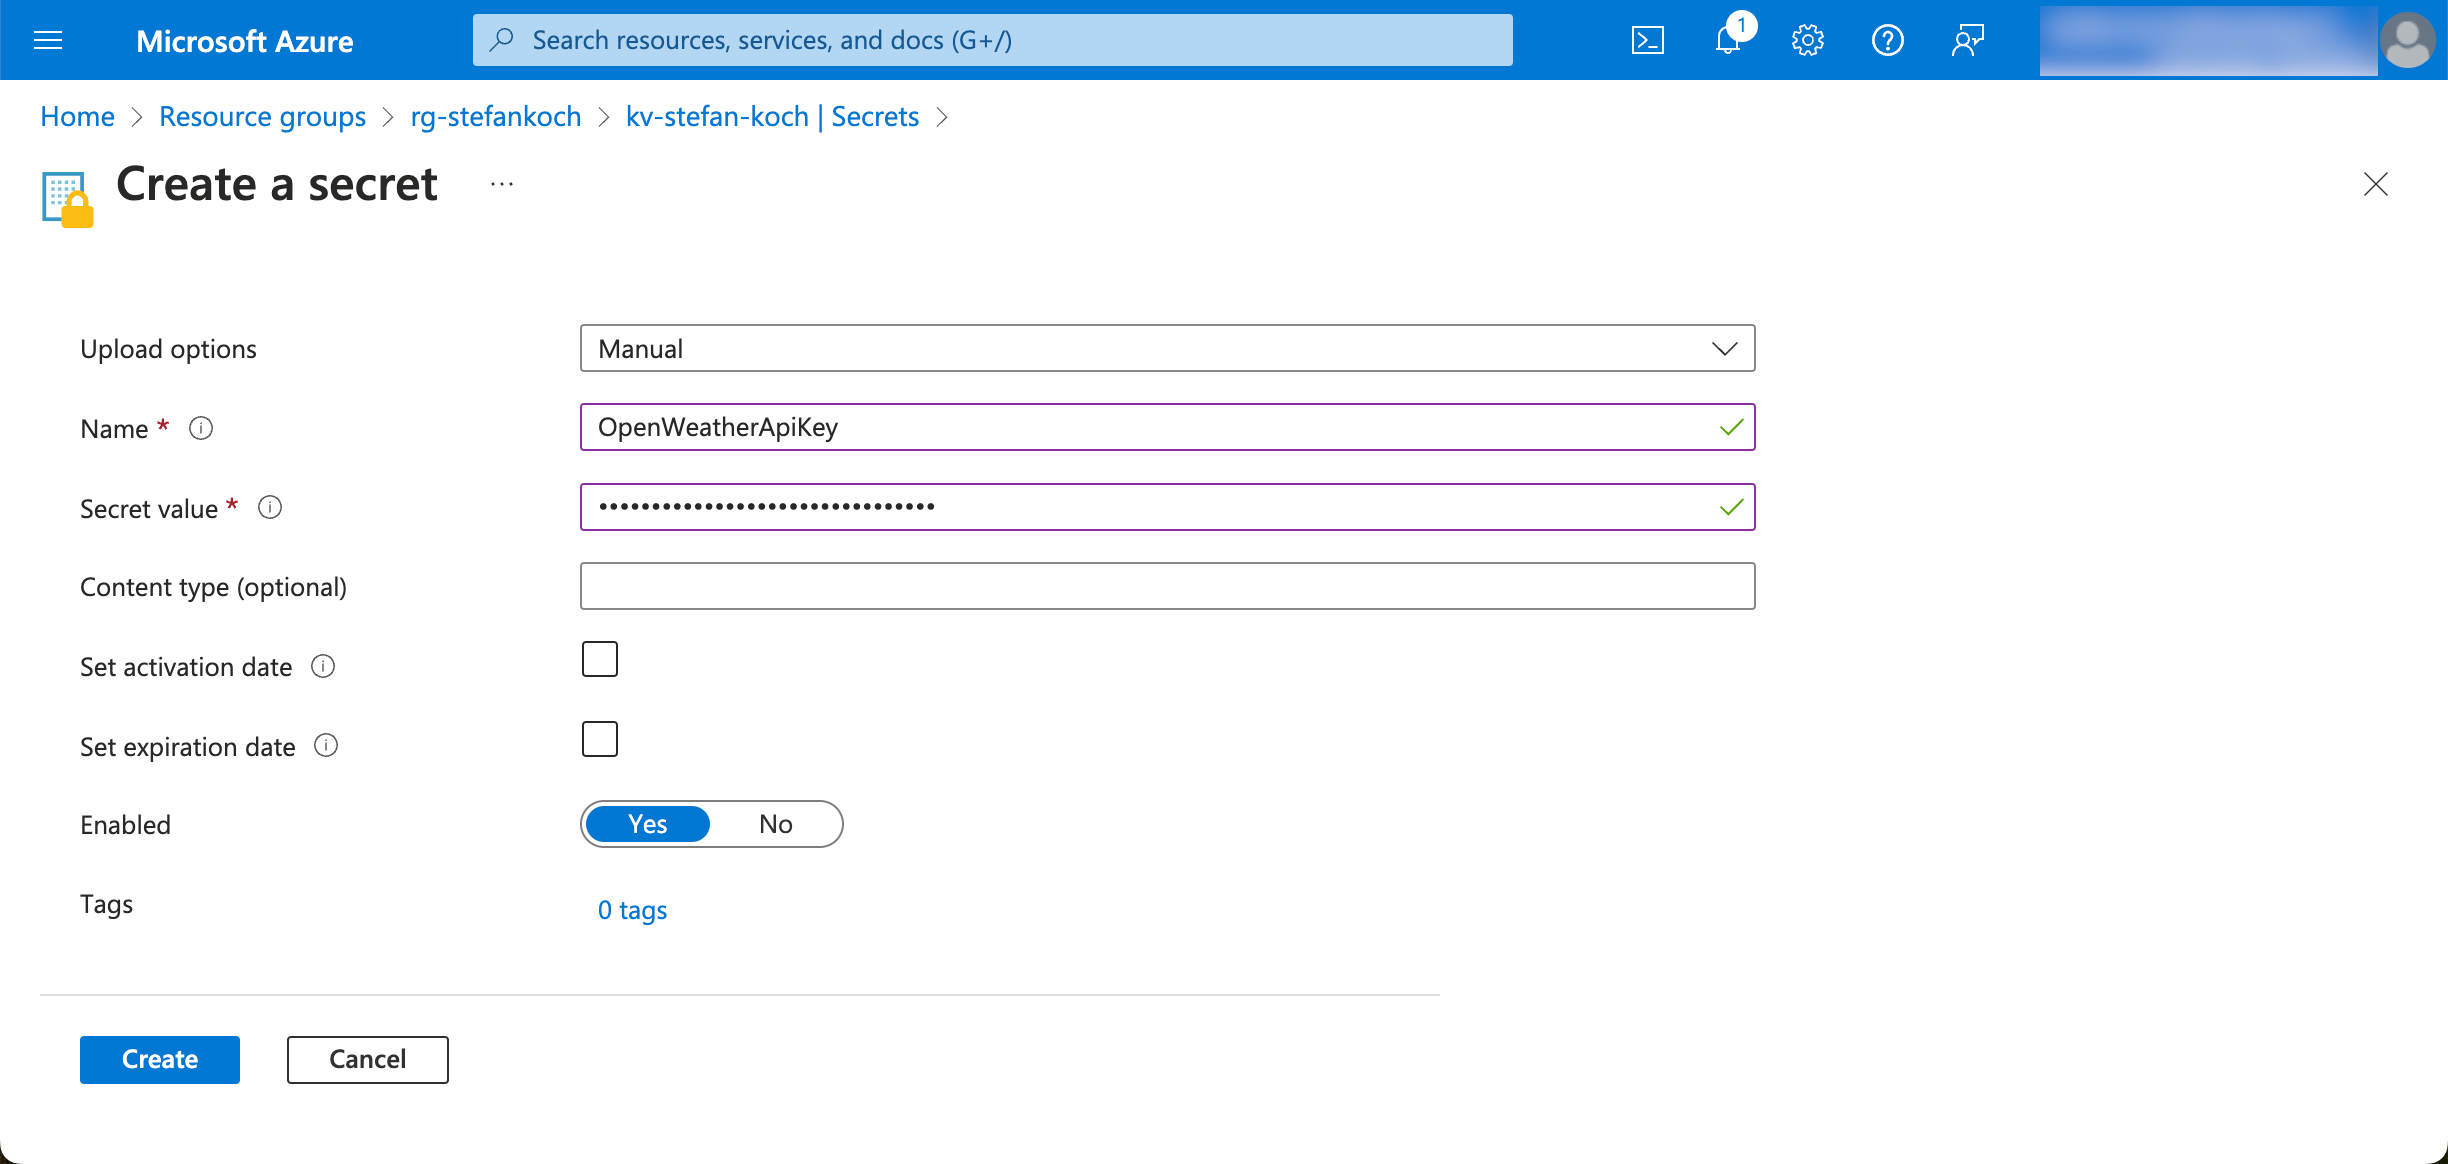
The secret can be addressed later via the name.
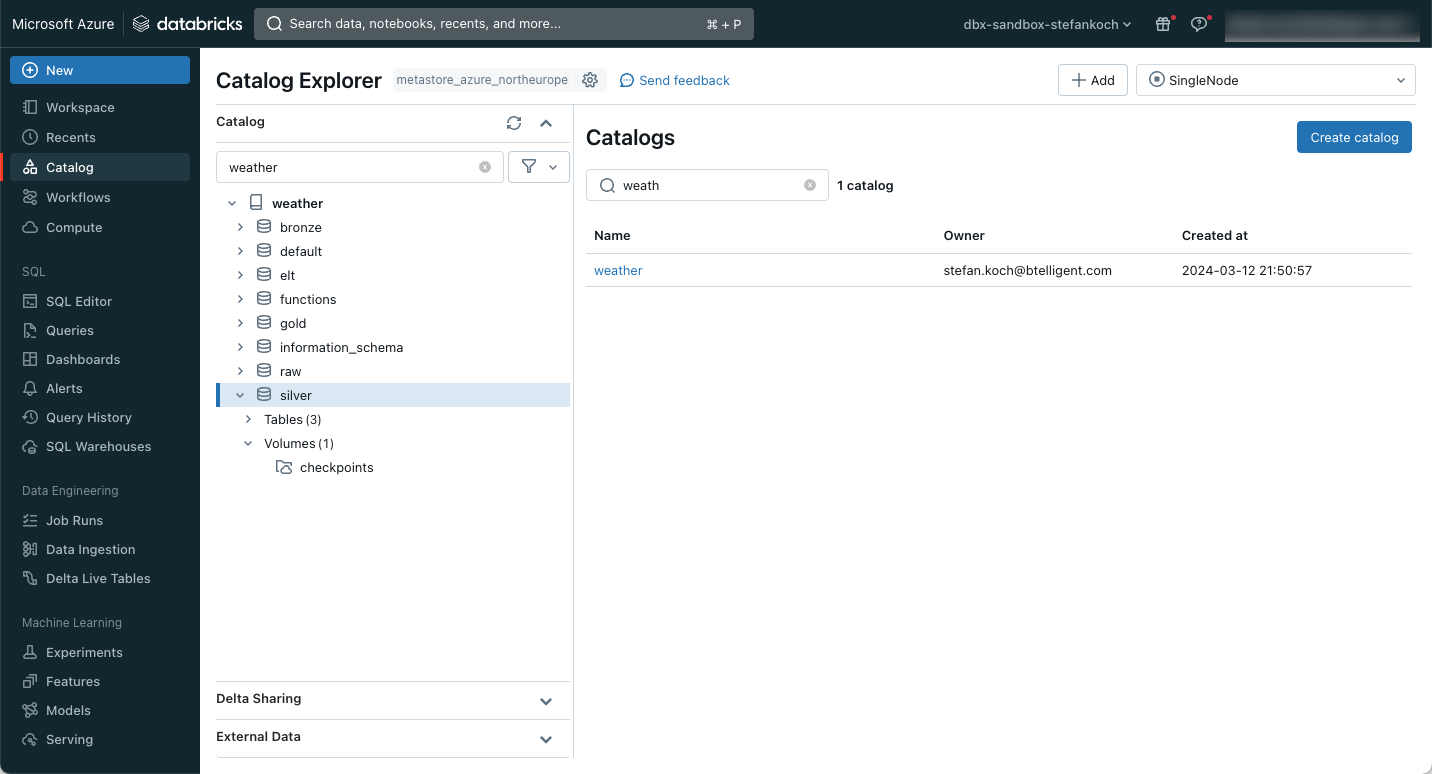
Prepare Databricks Unity Catalog
In Databricks, I create a new catalog for my example, which I call “weather”. I then create 4 schemas within this catalog:
- bronze
- silver
- gold
- elt
Within the silver schema, I create a volume in which I can save files. In my case, checkpoints are stored there, so I name the volumes accordingly. The whole thing then looks like this.
If you don’t know how to create a catalog, the schemas and a volume, have a look here.
Create a Databricks cluster
Downloading API data with a Spark Cluster is actually like shooting sparrows with cannons. Actually, but… Of course, you can use a serverless service like an Azure Function, or a PaaS offering like the Azure Factory. But doing it directly with a Databricks cluster can also make sense. If you need the cluster for post-processing, then the cluster is already up and running, and downloading the data before processing only takes a few seconds. You can save money by choosing a single-node cluster with the smallest version. For this reason, I have created a small single-node cluster with an F4s_v2 node, which has 8 GB of memory and 4 cores. I chose the latest LTS version for the runtime. Photon can be left out for this application. I mainly use the cluster for development, so I set it to shut down automatically after 30 minutes of inactivity.

Connect Github repository in Databricks
I will save the code for this example in a Github repository. This can be easily integrated into Databricks.

Further information on repos in Databricks can be found here: https://docs.databricks.com/en/repos/index.html
The code from this example can be found in this Github-Repo.
Architecture
The architecture for this small setup is as follows:
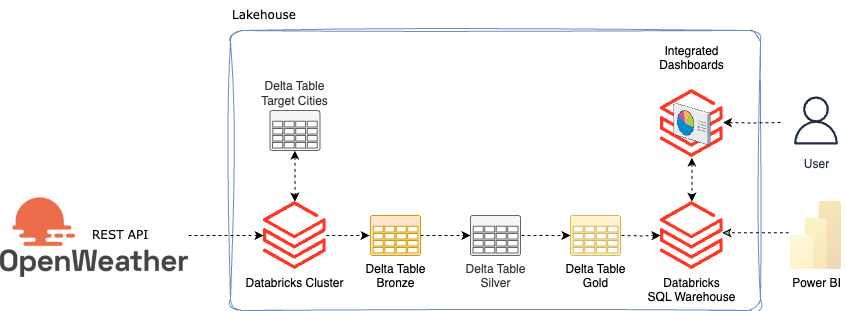
Since I want to download the weather for several cities, I create a delta table in which I write city names. This means that any cities can be added later without having to adapt the source code.
The first step is to read out the cities. Then I also get some additional information about the respective cities from Openweather and save it in a bronze table. The weather and another API for air pollution are saved in the bronze table. The data is then processed and refined in silver. In Gold, they are then made available as a view so that they can either be visualized with integrated dashboards in Databricks or obtained from Databricks using external tools such as Power BI.
Create ELT tables
I save the “target_cities” table with the target city names in the “elt” schema. To do this, I have written a small notebook called “00_Setup_Environment”.
In a first step, I create the table and fill it with the city names.
CREATE TABLE IF NOT EXISTS weather.elt.target_cities (
  id INT NOT NULL PRIMARY KEY,
  city VARCHAR(100)
  );

INSERT INTO weather.elt.target_cities (id, city)
VALUES
  (1, 'Lucerne'),
  (2, 'Zurich'),
  (3, 'Geneva'),
  (4, 'Basel'),
  (5, 'Zug'),
  (6, 'Bern'),
  (7, 'Winterthur'),
  (8, 'Chur'),
  (9, 'Lugano'),
  (10, 'Lausanne'),
  (11, 'Thun'),
  (12, 'Sitten'),
  (13, 'Olten'),
  (14, 'Schaffhausen'),
  (15, 'Aarau'),
  (16, 'Oberrueti'),
  (17, 'Davos'),
  (18, 'Interlaken'),
  (19, 'Kloten'),
  (20, 'Ascona')
API Load
In another notebook “02_OpenWeather_API_2_Bronze” I download the corresponding data from the API.
There are several ways to download the data. For example, you could save the data as JSON in the Datalake and then process it further. However, I have decided to save the data directly from the API in a delta table, so I save myself the step of saving the data in the data lake. In addition to processing, this also saves storage costs.
A few Python libraries are required for the following steps.
import requests
import json
import uuid

from datetime import datetime
from pyspark.sql.functions import lit, col
As already mentioned, I have saved the API key in a KeyVault, which I retrieve and save in a variable. You have to adapt this step to your own environment.
api_key = dbutils.secrets.get("kv", "OpenWeatherApiKey")I will add a current timestamp to the data and assign a load ID. I create the load ID via uuid.
load_id             = str(uuid.uuid4())
utc_timestamp       = datetime.utcnow()
I create the bronze tables for the weather (current) and air pollution (air_pollution) without a schema. The schema is then created afterwards via schema evolution.
CREATE TABLE IF NOT EXISTS weather.bronze.current;
CREATE TABLE IF NOT EXISTS weather.bronze.air_pollution;
I assign a schema to the city table because I want to process the data in a merge, and I need a schema for that.
CREATE TABLE IF NOT EXISTS weather.bronze.cities
    (Response MAP<STRING, STRING>,
     LoadID STRING,
     LoadTimeStamp TIMESTAMP,
     City STRING,
     Longitude STRING,
     Latitude STRING
    );
I have written a small function for the REST call.
def get_response(url):
    try:
        response = requests.get(url)
        return response
    except Exception as e:
        print(e)
        raise
I read the city names from the target_cities_table into a dataframe and then create a list from it.
df_target_cities = spark.read.table(target_cities_table)
target_cities = df_target_cities.select("city").rdd.flatMap(lambda x: x).collect()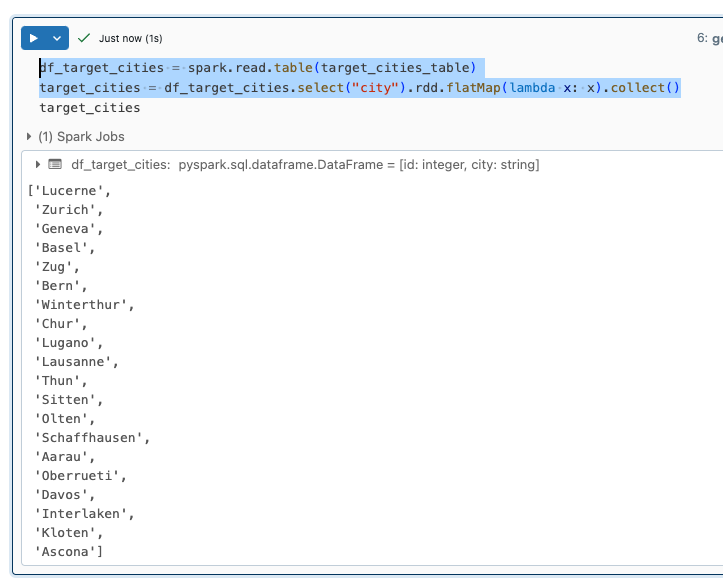
I then iterate over the city names and make a REST call for each city. Within the loop, I create a dataframe from the response. I have also written a small function for this, in which the load timestamp and the load ID are also added. In SQL, you should process data in batches and not individual rows. So I pack all the dataframes from the loop into a single dataframe. I load the data for the cities from the following API:https://openweathermap.org/api/geocoding-api
def create_dataframe(response):
    response_dict = json.loads(response.content)
    df = spark.createDataFrame([response_dict])
    df = (df
          .withColumn("LoadID", lit(load_id))
          .withColumn("LoadTimeStamp", lit(utc_timestamp))
    )
    return df

df_cities = None
for city in target_cities:
    print(f"Load metadata for: {city}")
    url = f"http://api.openweathermap.org/geo/1.0/direct?q={city}&&appid={api_key}"
    response = get_response(url)

    df = create_dataframe(response)

    if df_cities is None:
        df_cities = df
    else:
        df_cities = df_cities.unionByName(df, allowMissingColumns=True)
Now that I have created a dataframe for all responses for the cities, I transform the dataframe so that the city name, longitude and latitude are added as an additional column.
df_cities = (df_cities
                .withColumnRenamed("_1", "Response")
                .withColumn("City", col("Response")["name"])
                .withColumn("Longitude", col("Response")["lon"])
                .withColumn("Latitude", col("Response")["lat"])
)
display(df_cities)
As a rule, the data for the cities does not change, so I don’t want to add all the data to the table. However, something could change, in which case I want to have the changes in the bronze table. Or new cities are added, in which case this data should be added. An SQL merge is ideal for this use case. You could either write the merge in PySpark or in SQL. I prefer SQL because it requires a little less lines of code.
To do this, I create a temporary view from the dataframe.
df_cities.createOrReplaceTempView("TempViewCities")This view can then be used for the merge.
%sql
MERGE INTO weather.bronze.cities AS target
  USING TempViewCities AS source
    ON target.City = source.City
    AND target.Longitude = source.Longitude
    AND target.Latitude = source.Latitude
WHEN MATCHED THEN
  UPDATE SET *
WHEN NOT MATCHED THEN
  INSERT *
As can be seen from the code, new city data is added and existing data is updated.
From this table I now create a list with the city names, longitude and latitude.
# Create a list of cities from the bronze.weather.cities table, containing Longitude and Latitude
cities_list = spark.sql("SELECT City, Longitude, Latitude FROM weather.bronze.cities").collect()
I can use this list to iterate over it and query the weather. Longitude and latitude are required for this. I call the following API for this: https://openweathermap.org/current
Similar to the city data, I create a dataframe from this.
df_current = None
for c in cities_list:
    print(f"Load current weather data for: {c.City}")
    url = f"https://api.openweathermap.org/data/2.5/weather?lat={c.Latitude}&lon={c.Longitude}&appid={api_key}&units=metric"
    response = get_response(url)

    df = create_dataframe(response)

    if df_current is None:
        df_current = df
    else:
        df_current = df_current.unionByName(df, allowMissingColumns=True)
I now save the dataframe directly in a deltatable. I select the option “mergeSchema” as true, so the schema of the table adapts to the dataframe. I also set the mode to “append”, i.e. the data is added.
(
    df_current.write.format("delta")
    .mode("append")
    .option("mergeSchema", "true")
    .saveAsTable("weather.bronze.current")
)
I will now repeat the procedure for air pollution.
df_air_pollution = None

for c in cities_list:
    print(f"Load air pollution data for: {c.City}")

    url = f"http://api.openweathermap.org/data/2.5/air_pollution?lat={c.Latitude}&lon={c.Longitude}&appid={api_key}"
    response = get_response(url)

    df = create_dataframe(response)

    df = df.withColumn("City", lit(city))

    if df_air_pollution is None:
        df_air_pollution = df
    else:
        df_air_pollution = df_air_pollution.unionByName(df, allowMissingColumns=True)
(
df_air_pollution.write.format("delta")
.mode("append")
.option("mergeSchema", "true")
.saveAsTable("weather.bronze.air_pollution")
)In the case of the bronze tables, I have deliberately dispensed with all transformations and save the data as it arrives. Here is an example of the weather data:

Bronze to Silver
When processing from Bronze to Silver, I will transform the data. I have to import a few libraries first.
from pyspark.sql.functions import col, from_unixtime, to_timestampI write a function for each of the transformations. Again, there are several possibilities. For example, you could write a dynamic function that smoothes out all nested columns. But I have deliberately avoided this and smooth the columns manually. As the original data is still saved in the Bronze, I could adjust the transformation afterwards and reload it into the Silver Layer.
def transform_columns_current(df):
    """
    transforms the input dataframe for current weather data
    - converts columns
    - adds data from nested columns as additional columns
    """
    df = (
        df
        .select(
            col("base").alias("Base"),
            # "clouds",
            col("clouds")["all"].alias("Clouds_All"),
            col("cod").alias("Cod"),
            # "coord",
            col("coord")["lon"].alias("Coord_Lon"),
            col("coord")["lat"].alias("Coord_Lat"),
            # "dt",
            to_timestamp(from_unixtime(col("dt"))).alias("Weather_TimeStamp"),
            col("id").alias("ID"),
            # "main",
            col("main")["feels_like"].alias("Main_Feels_Like"),
            col("main")["temp_min"].alias("Main_Temp_Min"),
            col("main")["pressure"].alias("Main_Pressure"),
            col("main")["humidity"].alias("Main_Humidity"),
            col("main")["temp"].alias("Main_Temp"),
            col("main")["temp_max"].alias("Main_Temp_Max"),
            col("name").alias("City"),
            # "rain",
            col("rain")["1h"].alias("Rain_1h"),
            # "sys",
            col("sys")["country"].alias("Sys_Country"),
            col("sys")["id"].alias("Sys_ID"),
            to_timestamp(from_unixtime(col("sys")["sunrise"])).alias("Sys_Sunrise"),
            to_timestamp(from_unixtime(col("sys")["sunset"])).alias("Sys_Sunset"),
            col("sys")["type"].alias("Sys_Type"),
            col("timezone").alias("Timezone"),
            col("visibility").alias("Visibility"),
            # "weather",
            # col("weather")[0],
            col("weather")[0]["icon"].alias("Weather_0_Icon"),
            col("weather")[0]["description"].alias("Weather_0_Description"),
            col("weather")[0]["main"].alias("Weather_0_Main"),
            col("weather")[0]["id"].alias("Weather_0_ID"),
            # "wind",
            col("wind")["speed"].alias("Wind_Speed"),
            col("wind")["deg"].alias("Wind_Deg"),
            "LoadID",
            "LoadTimeStamp"
            )
        )
    return df
The commented out columns were used to create the function, I have left them as they are. You can also see the transformation of the Unix timestamp into a timestamp type.
to_timestamp(from_unixtime(col("dt"))).alias("Weather_TimeStamp"),I proceeded in the same way with the transformations for air pollution.
def transform_columns_air_pollution(df):
    """
    transforms the input dataframe for air_pollution
    - converts columns
    - adds data from nested columns as additional columns
    """
    df = (
        df
        .select(
            col("City"),
            # col("coord").alias("Coord"),
            col("coord")["lon"].alias("Coord_Lon"),
            col("coord")["lat"].alias("Coord_Lat"),
            # col("list")[0].alias("list"),
            col("list")[0]["dt"].alias("List_dt"),
            # col("list")[0]["components"].alias("List_Components"),
            col("list")[0]["components"]["pm2_5"].alias("List_Components_pm2_5"),
            col("list")[0]["components"]["pm10"].alias("List_Components_pm10"),
            col("list")[0]["components"]["no2"].alias("List_Components_no2"),
            col("list")[0]["components"]["co"].alias("List_Components_co"),
            col("list")[0]["components"]["nh3"].alias("List_Components_nh3"),
            col("list")[0]["components"]["o3"].alias("List_Components_o3"),
            col("list")[0]["components"]["no"].alias("List_Components_no"),
            col("list")[0]["components"]["so2"].alias("List_Components_so2"),
            col("list")[0]["main"]["aqi"].alias("List_main_aqi"),
            "LoadID",
            "LoadTimeStamp")
        )
    return df
And also a few small transformations for the city information.
def transform_columns_cities(df):
    """
    transforms the input dataframe for cities
    - converts columns
    - adds data from nested columns as additional columns
    """
    df = (
        df
        .select(
            col("City"),
            col("Longitude"),
            col("Latitude"),
            col("Response").alias("Response"),
            col("Response")["state"].alias("State"),
            col("Response")["country"].alias("Country"),
            "LoadID",
            "LoadTimeStamp")
        )
    return df
The functions can now be called after the data from the bronze table is loaded into a dataframe to transform it and then the transformed dataframe is saved into a silver table.
The point here is that with a classic batch approach, the entire bronze table must always be loaded, transformed, and then the silver table must be overwritten. Or you would have to implement a mechanism that only loads the data from the bronze table that has not yet been processed in the silver table. This could be done either with timestamps or the load ID. But that is more complex. And as I said, I only want to process the delta and not always the entire table. That would make the execution time longer and longer. For this reason, I decided to process the data using Spark Structured Streaming. This means that only the data that has not yet been transformed into the silver table is processed. With streaming, the system remembers where it stopped working during the last load. This is also the reason why I created a volume at the beginning. In the volume I specify a path where Spark saves the checkpoints from the stream.
In the first step, the bronze table is read in as a stream.
bronze_stream_weather = (spark
                        .readStream
                        .table("weather.bronze.current")
                        )
The transformation is then applied to the streaming data frame.
bronze_stream_weather = transform_columns_current(bronze_stream_weather)And in a 3rd step, the data is saved as a stream in a silver-delta table.
silver_stream_weather = (bronze_stream_weather
                        .writeStream
                        .format("delta")
                        .outputMode("append")
                        .option("checkpointLocation", f"/Volumes/weather/silver/checkpoints/currrent_weather/_checkpoint")
                        .trigger(once=True)
                        .toTable("weather.silver.current")
                        )

silver_stream_weather.awaitTermination()
As soon as all the data has been processed, the stream ends automatically.
I then repeat the same procedure for the other tables.
bronze_stream_air_pollution = (spark
                              .readStream
                              .table("weather.bronze.air_pollution")
                              )

bronze_stream_air_pollution = transform_columns_air_pollution(bronze_stream_air_pollution)

silver_stream_air_pollution = (bronze_stream_air_pollution
                              .writeStream
                              .format("delta")
                              .outputMode("append")
                              .option("checkpointLocation", f"/Volumes/weather/silver/checkpoints/air_pollution/_checkpoint")
                              .trigger(once=True)
                              .toTable("weather.silver.air_pollution")
                              )

silver_stream_air_pollution.awaitTermination()
bronze_stream_cities = (spark
.readStream
.table("weather.bronze.cities")
)
bronze_stream_cities = transform_columns_cities(bronze_stream_cities)
silver_stream_cities = (bronze_stream_cities
.writeStream
.format("delta")
.outputMode("append")
.option("checkpointLocation", f"/Volumes/weather/silver/checkpoints/cities/_checkpoint")
.trigger(once=True)
.toTable("weather.silver.cities")
)
silver_stream_cities.awaitTermination()Silver to Gold
I do not give users direct access to the silver tables. The views and tables in gold are intended for this purpose. You can also create different gold tables for the underlying silver tables, depending on the use case. I could now stream the data from silver to gold and save it as a table. But for this small use case, I will make do with a small view. If the performance is not sufficient, a persisted table can always be created afterwards.
Further notes: In my example, I have deliberately dispensed with dimensional modeling. This means that I have not implemented any fact and dimension tables, but have merged the tables as a joined view. That would be another chapter, which I will describe in a blog post. The focus of this post is on the OpenWeather API.
The notebook for creating the view is very small, and I created it in SQL.
CREATE OR REPLACE VIEW weather.gold.weather
AS
SELECT
  c.City,
  c.Longitude,
  c.Latitude,
  c.State,
  c.Country,

  w.Clouds_All,
  w.Weather_TimeStamp,
  w.Main_Feels_Like,
  w.Main_Temp_Min,
  w.Main_Temp,
  w.Main_Temp_Max,
  w.Rain_1h,
  w.Sys_Sunrise AS Sunrise,
  w.Sys_Sunset AS Sunset,
  w.Visibility,
  w.Wind_Speed,
  w.Wind_Deg

FROM            weather.silver.current AS w
INNER JOIN weather.silver.cities AS c
  ON  c.City      = w.City
Various improvements could certainly be made here.
Create a job
So that I can regularly load the data from the API, I put my 3 notebooks into a job. To do this, I go to the Workflows tab and click “Create Job”.

I create a separate task for each notebook, which are executed one after the other.
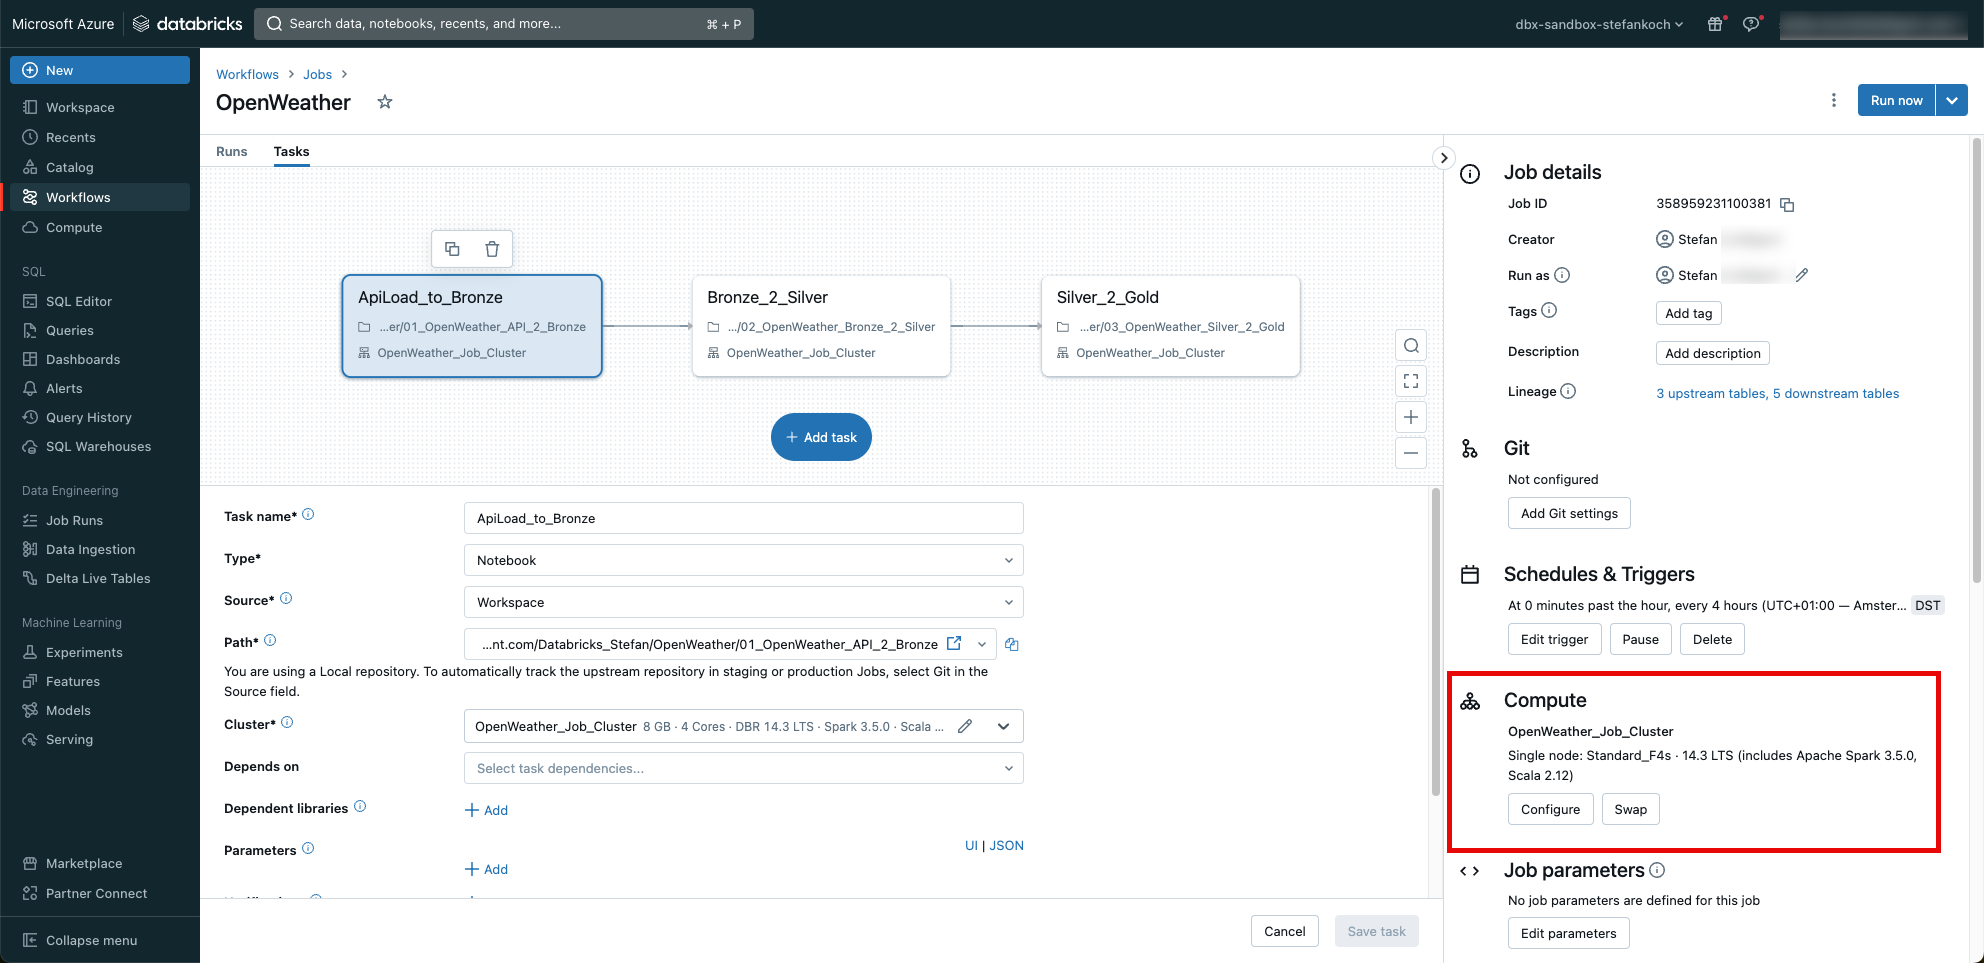
I trigger the job every 4 hours. And very importantly, I don’t use the “general purpose” cluster, but a job cluster. This schedules itself automatically after the job and generates no further costs.
Of course, all runs are logged and can be monitored.
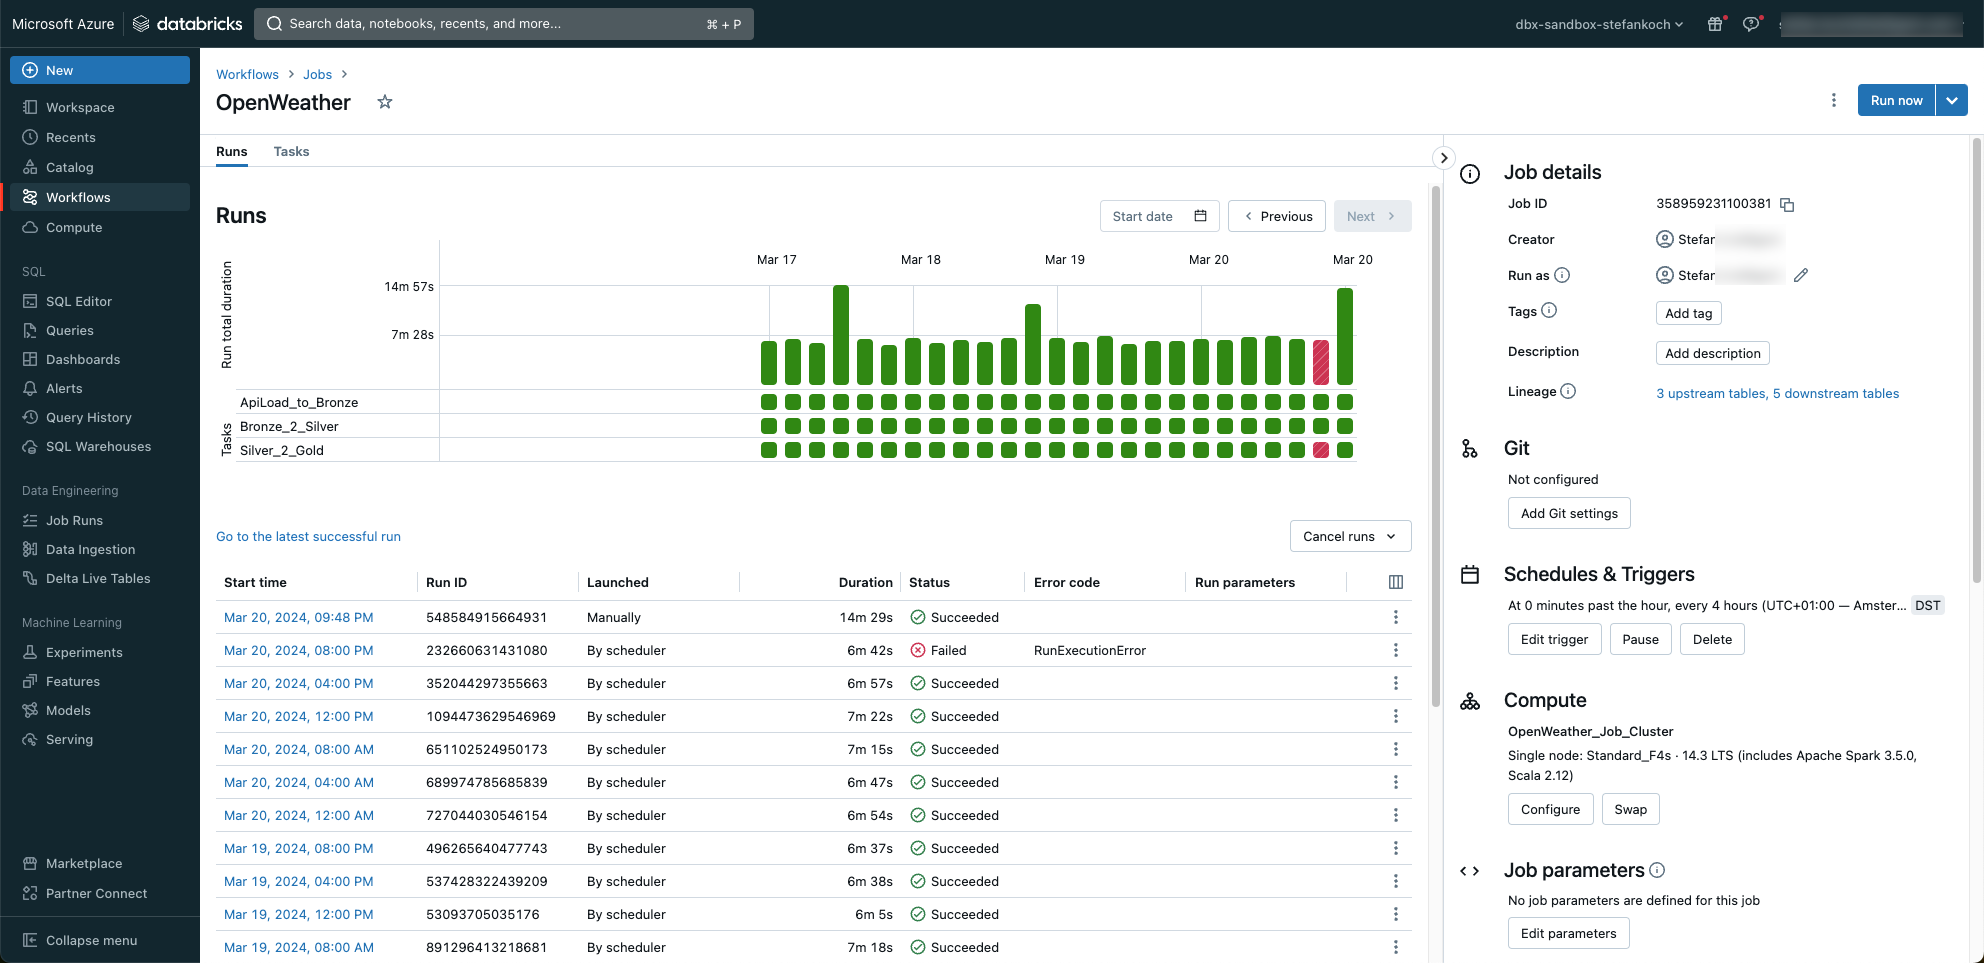
As you can see, I was tinkering with a notebook when a job was started 😉
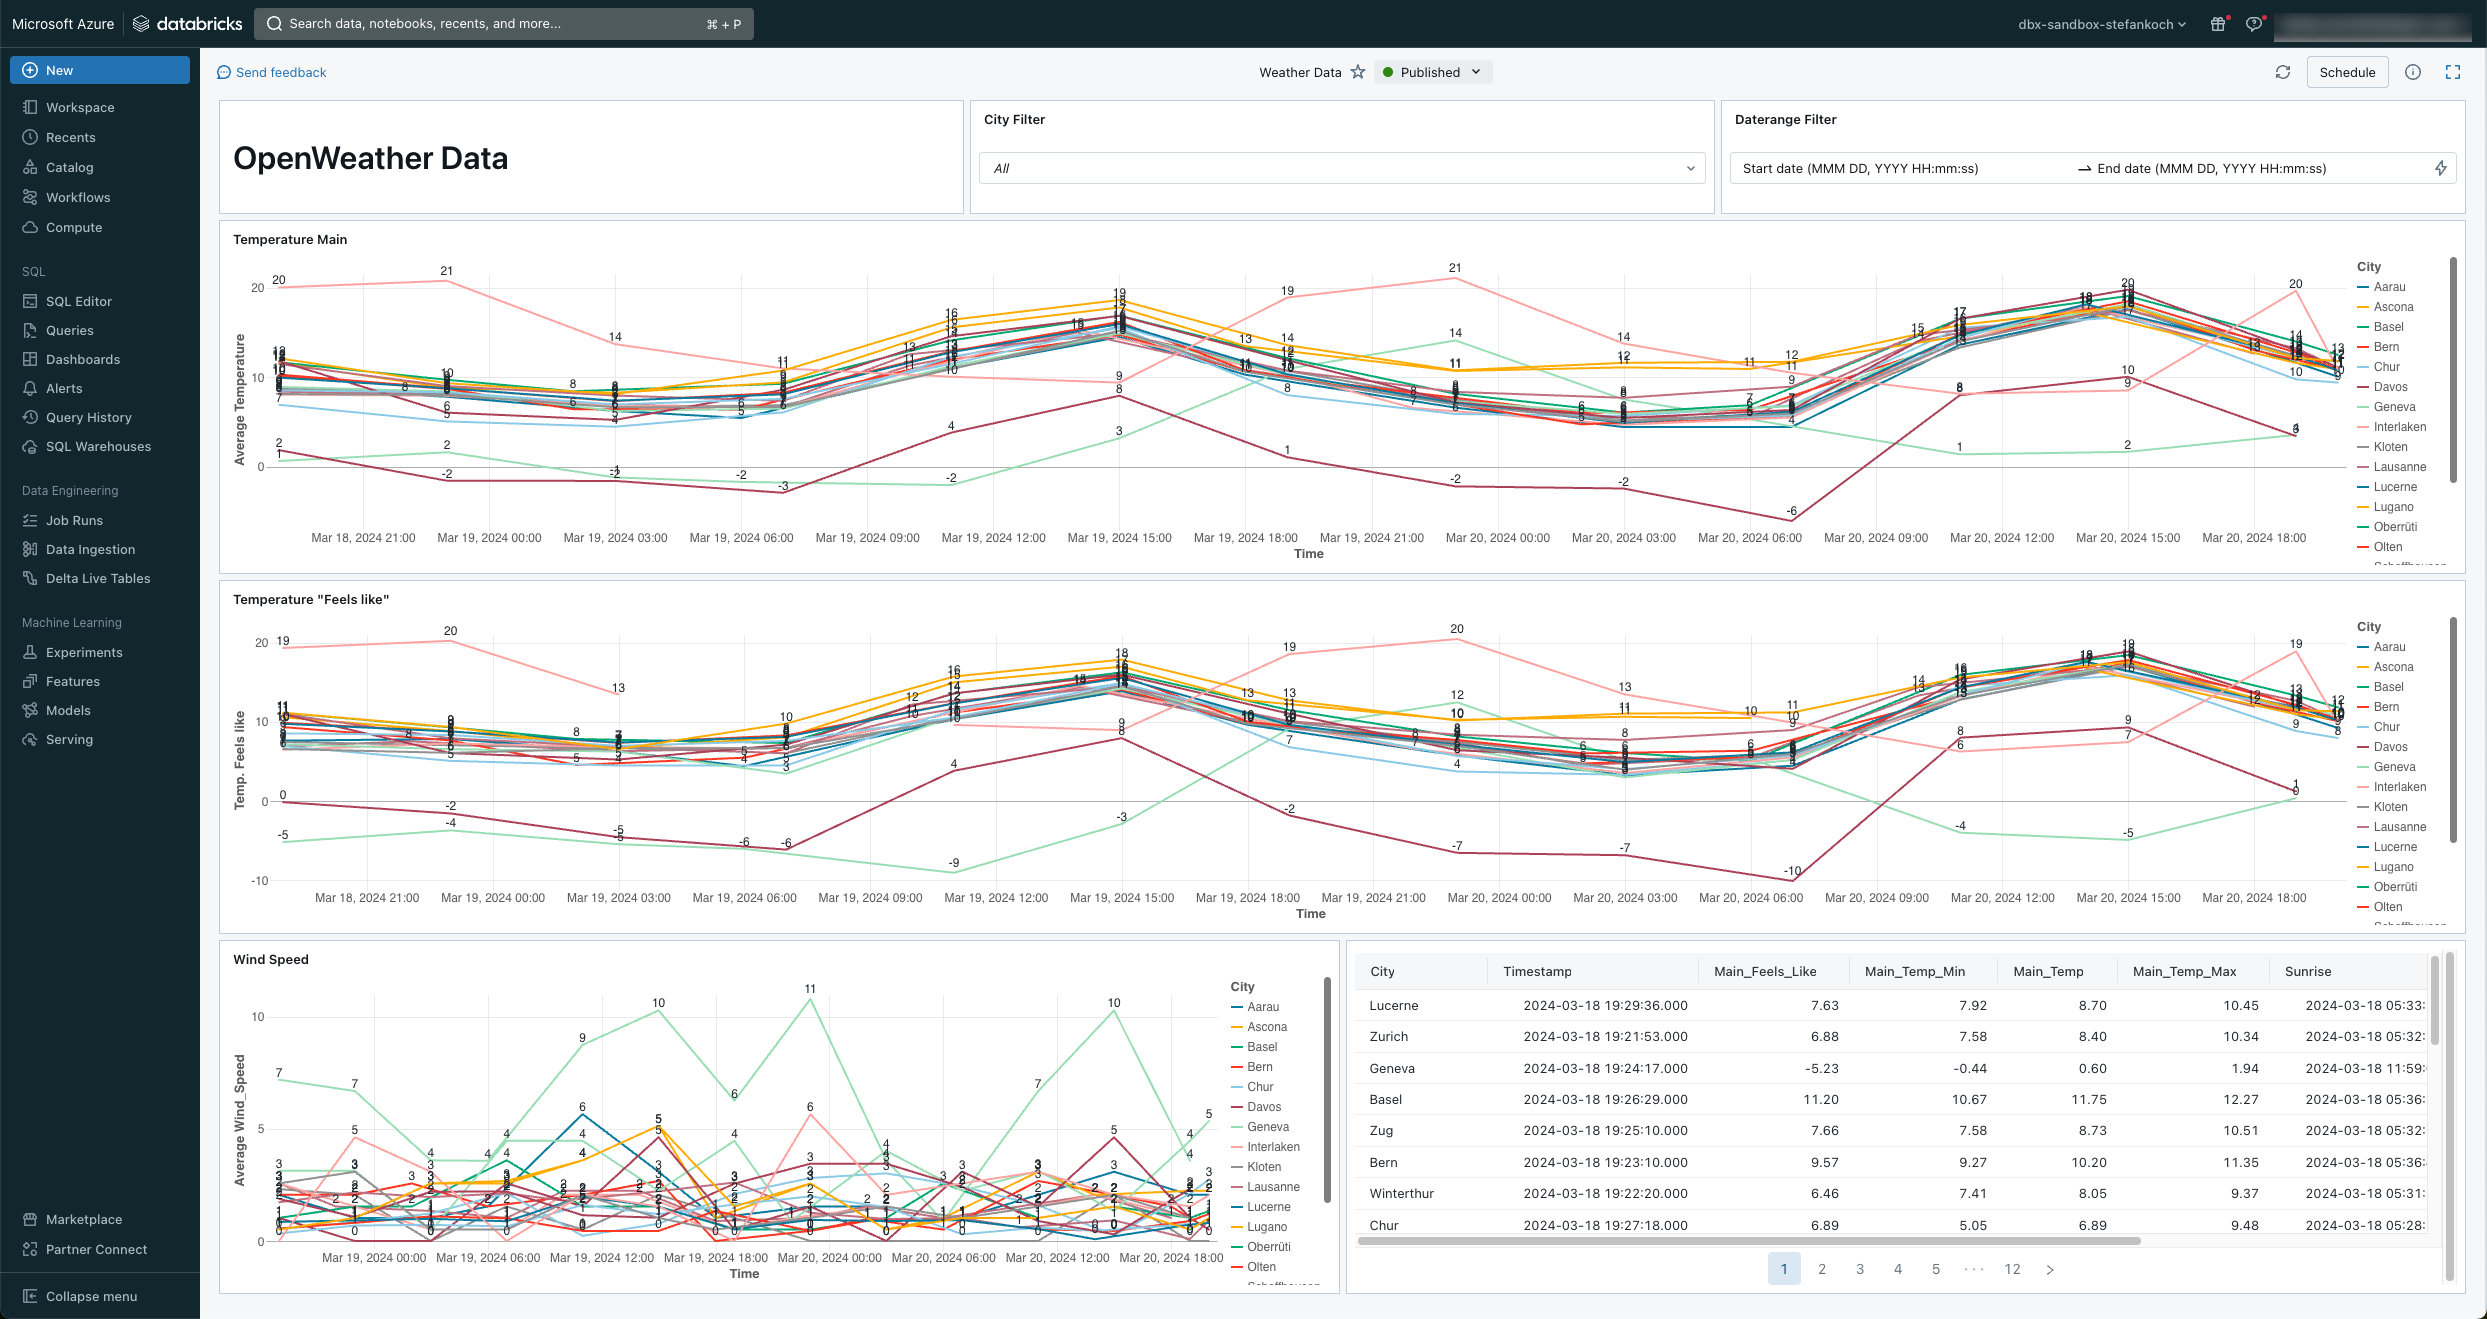
Lakeview Dashboard
At the end, I set up a simple Lakeview dashboard directly on my data.